A chart is a representation of data that can be used to convey and describe relationships, patterns and trends in that data. By using charts, data presentation can be done quickly, and the audience can understand it well. If you download a presentation template from our website, you may find a page where there is a chart in it. This time, we will discuss How to Edit Charts in Google Slides and Powerpoint.
[ez-toc]
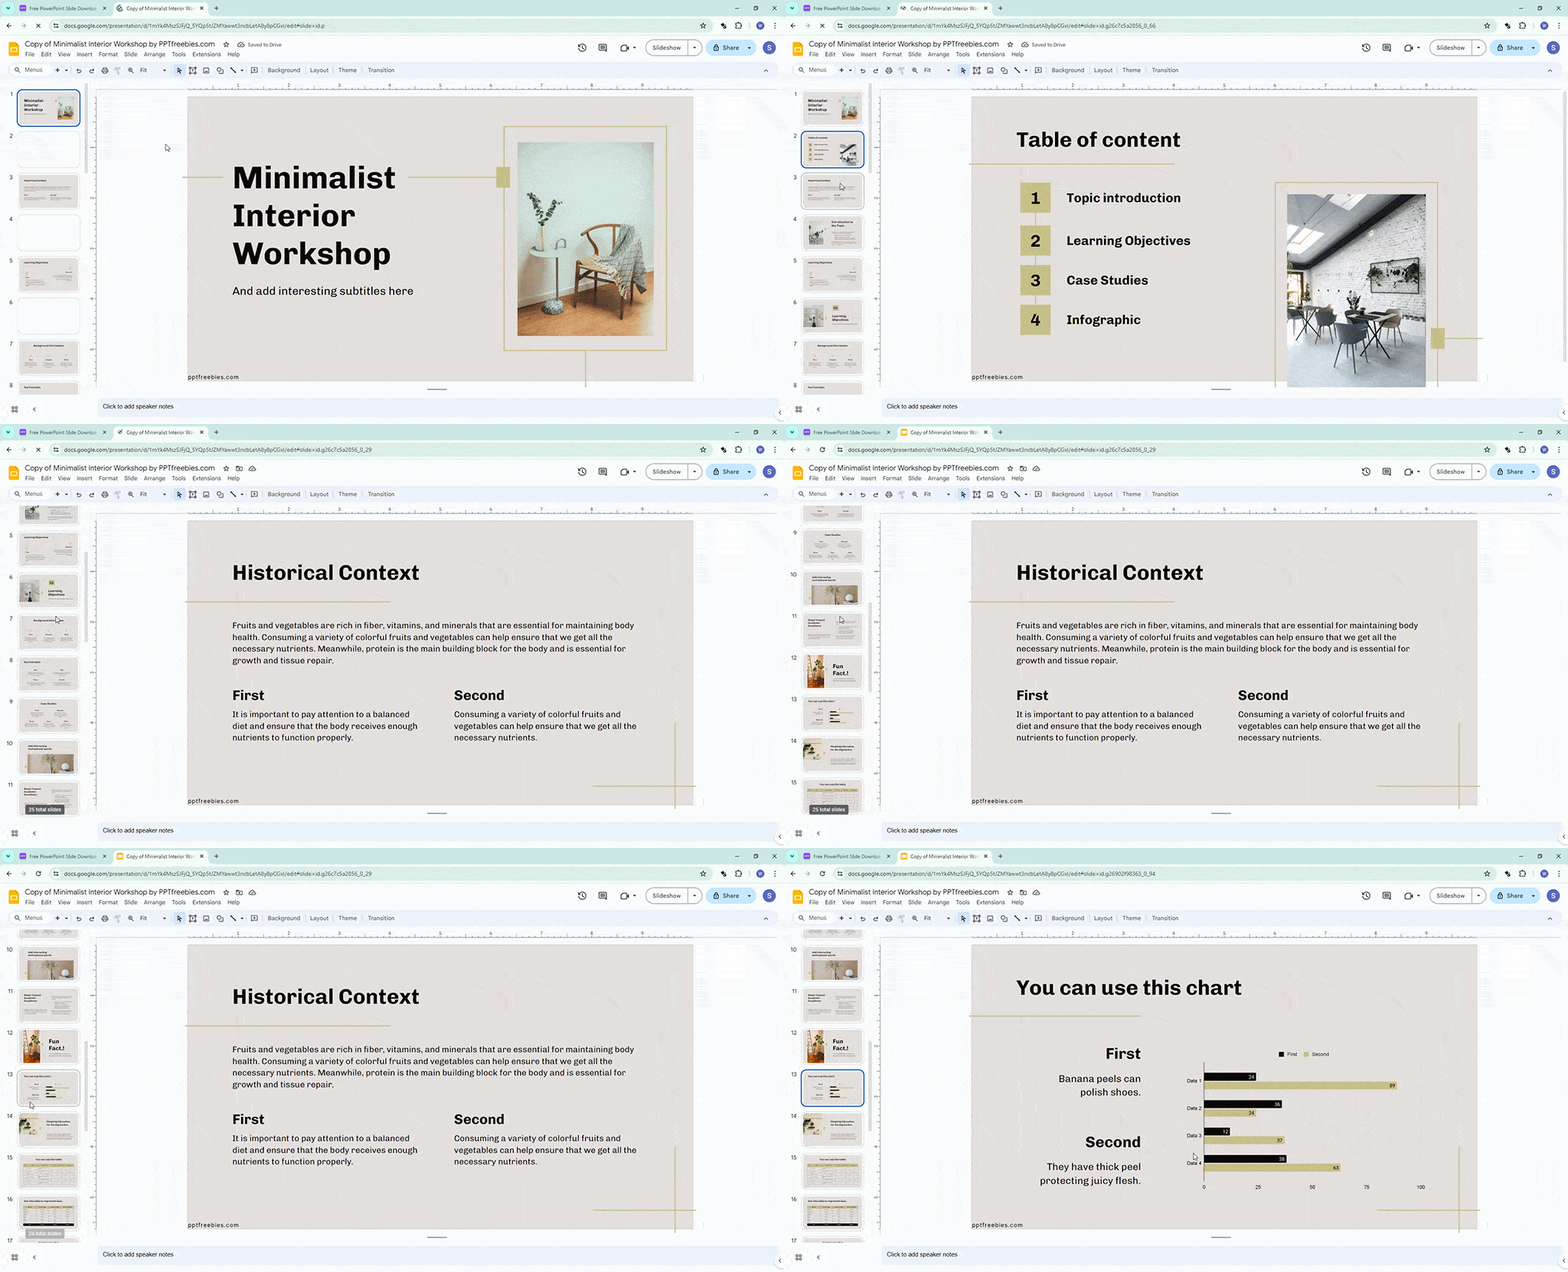
Find the page containing the chart.
In the presentation that you have downloaded, please look for the page that contains the chart in it.

Make a copy of the spreadsheet file
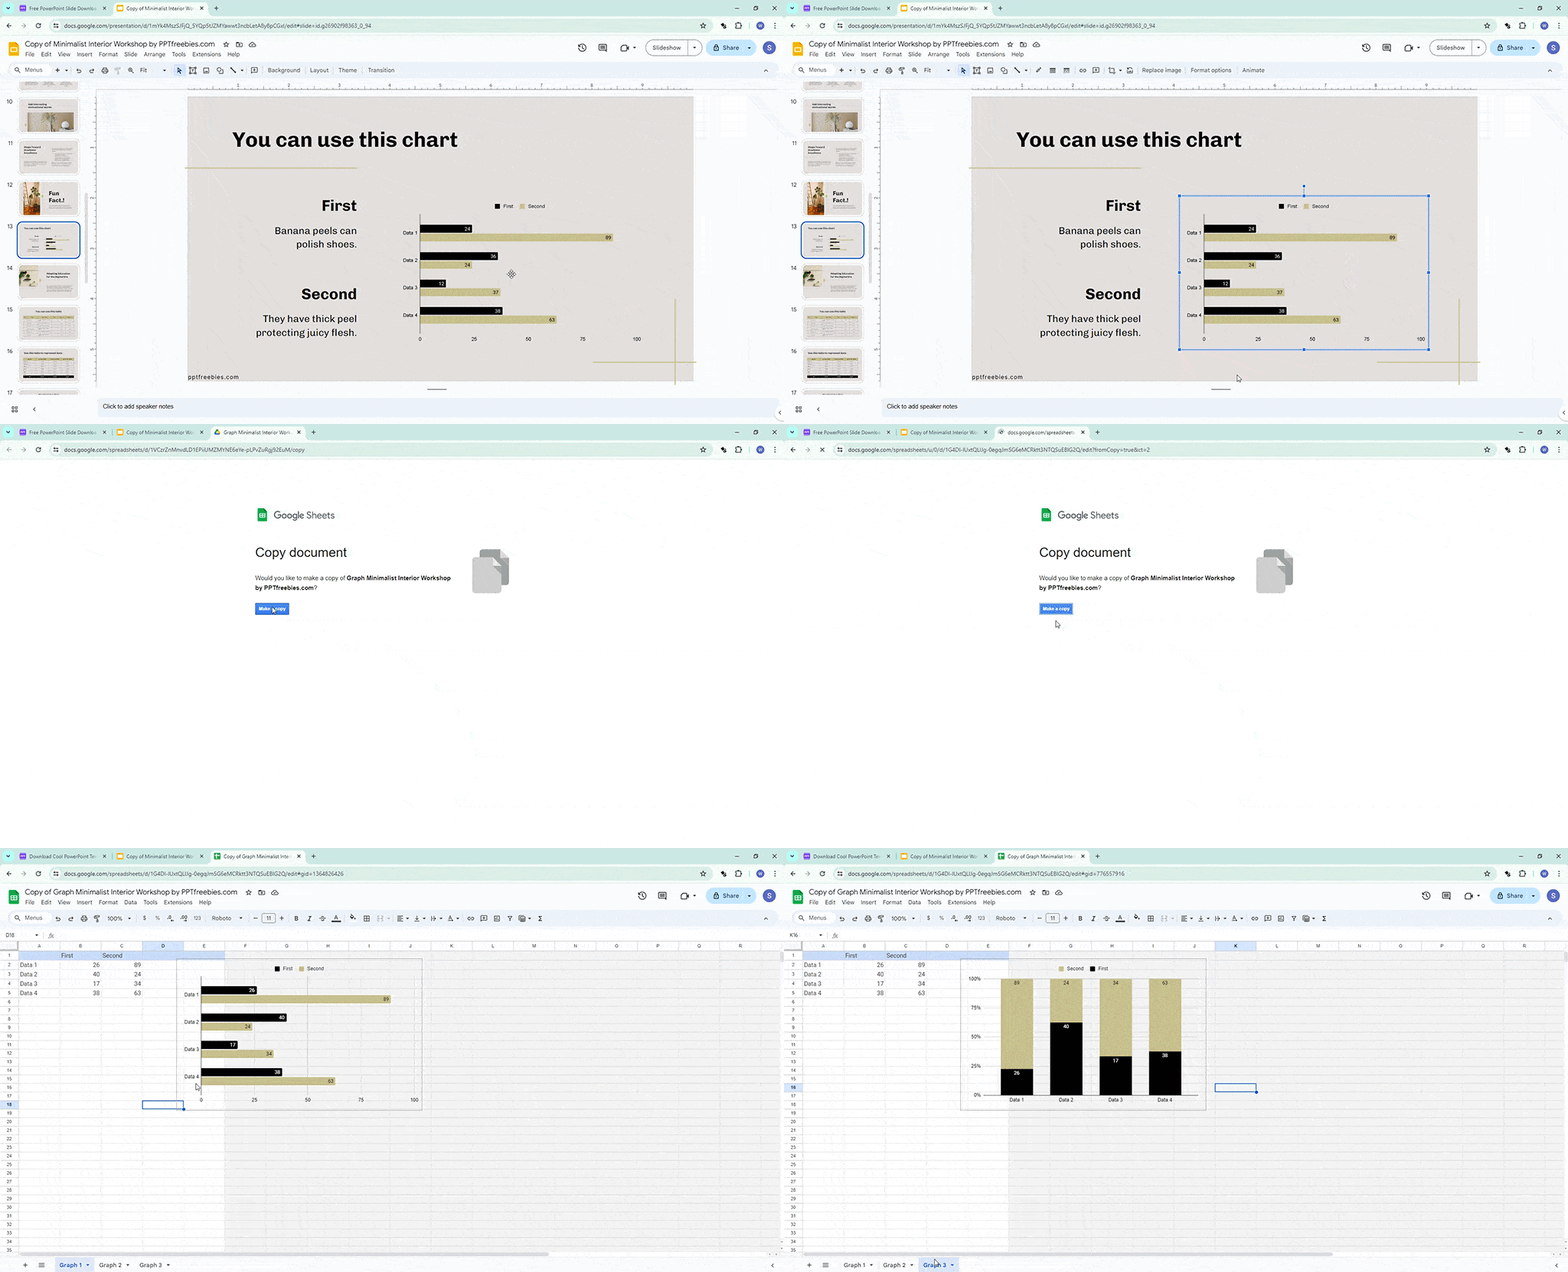
After you find the page containing the chart, you click on the chart in the form of an image, and a pop-up window will appear containing the linked spreadsheet file. If you are using PowerPoint, hold down the CTRL key, then click on the chart. A pop-up will appear with browser options that can be used. Click on the pop-up so that a new tab appears containing the question, “Would you like to make a copy?”. Click “Make a copy” to make it. (after the spreadsheet is open but you see the chart does not match the one on the slide, then you need to check each sheet in the spreadsheet file until you find the appropriate chart)

Adjust the chart
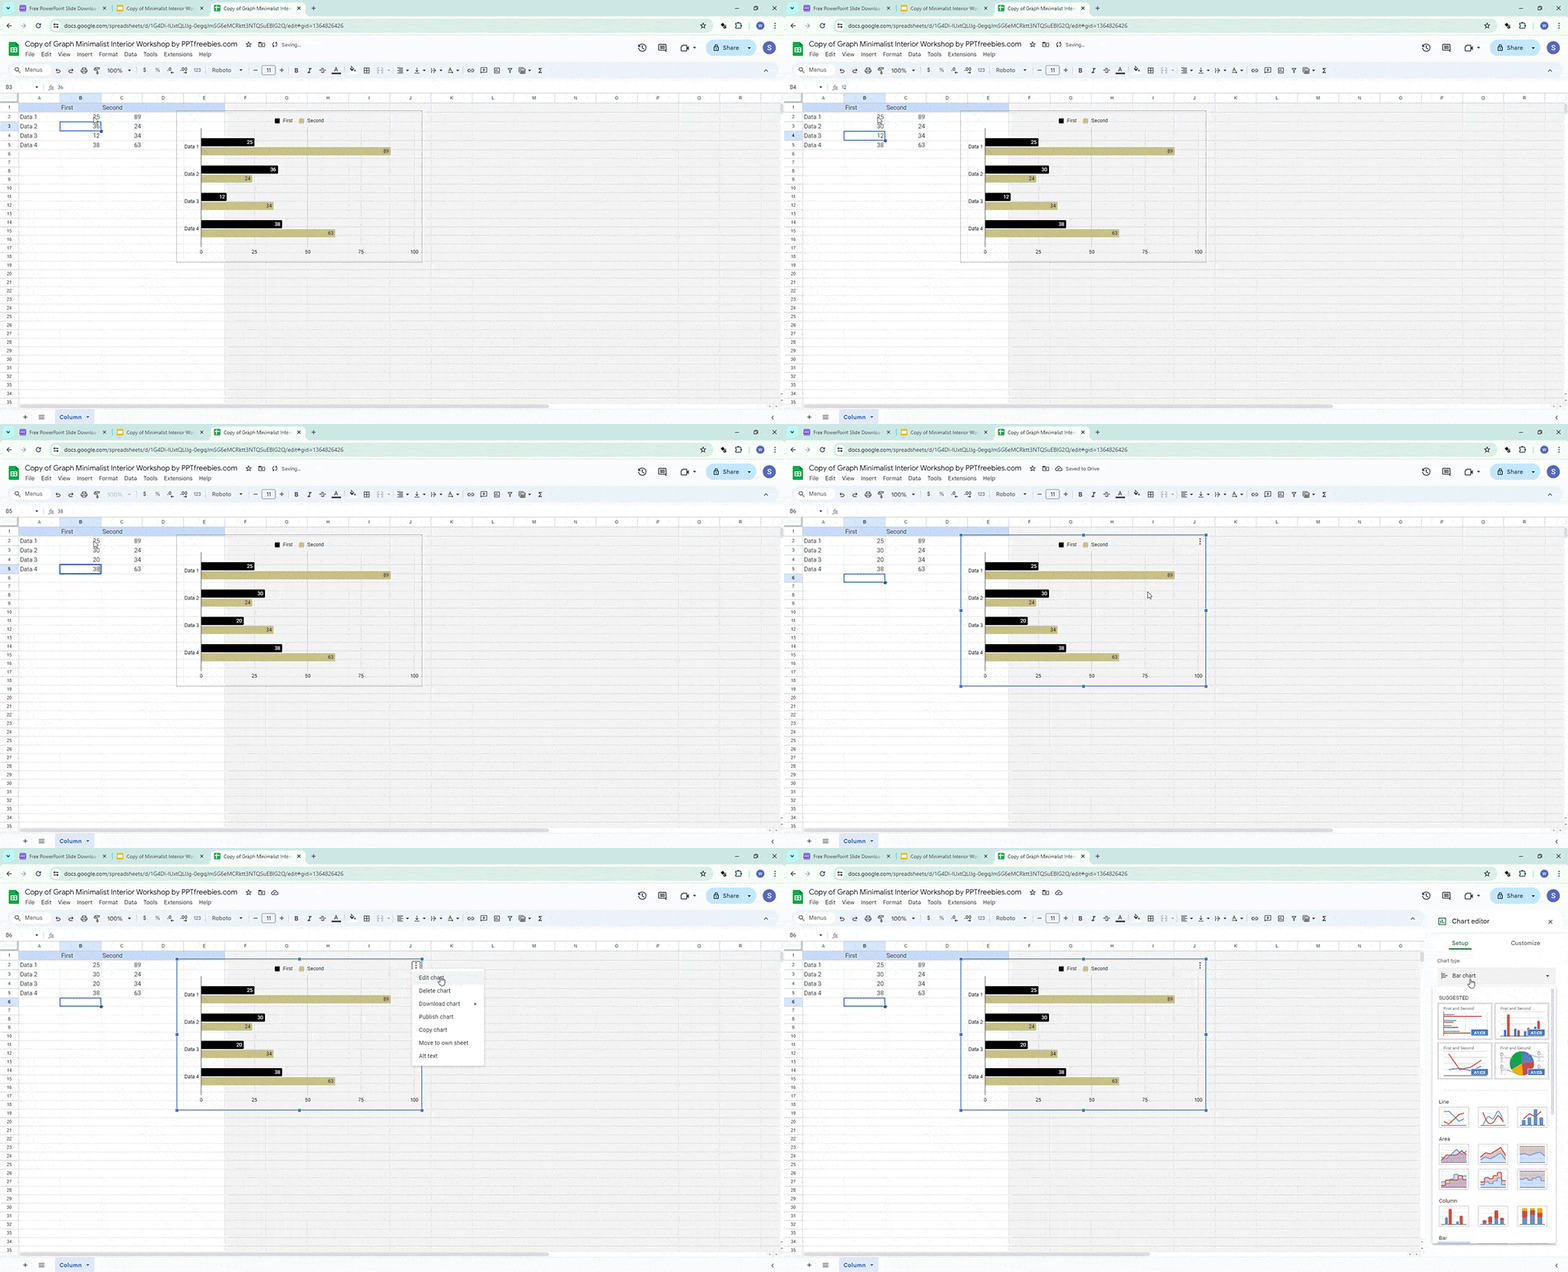
Next, you change the data according to what you want. To set the chart style, you can click on the chart, then click on point 3 in the right corner of the chart and select Edit chart. The chart editor panel will appear on the right. In this panel, you can make various graphic adjustments, such as changing the chart type and colour, removing some chart elements, and much more. Feel free to experiment yourself or learn how to edit charts in detail.

Paste the new Chart
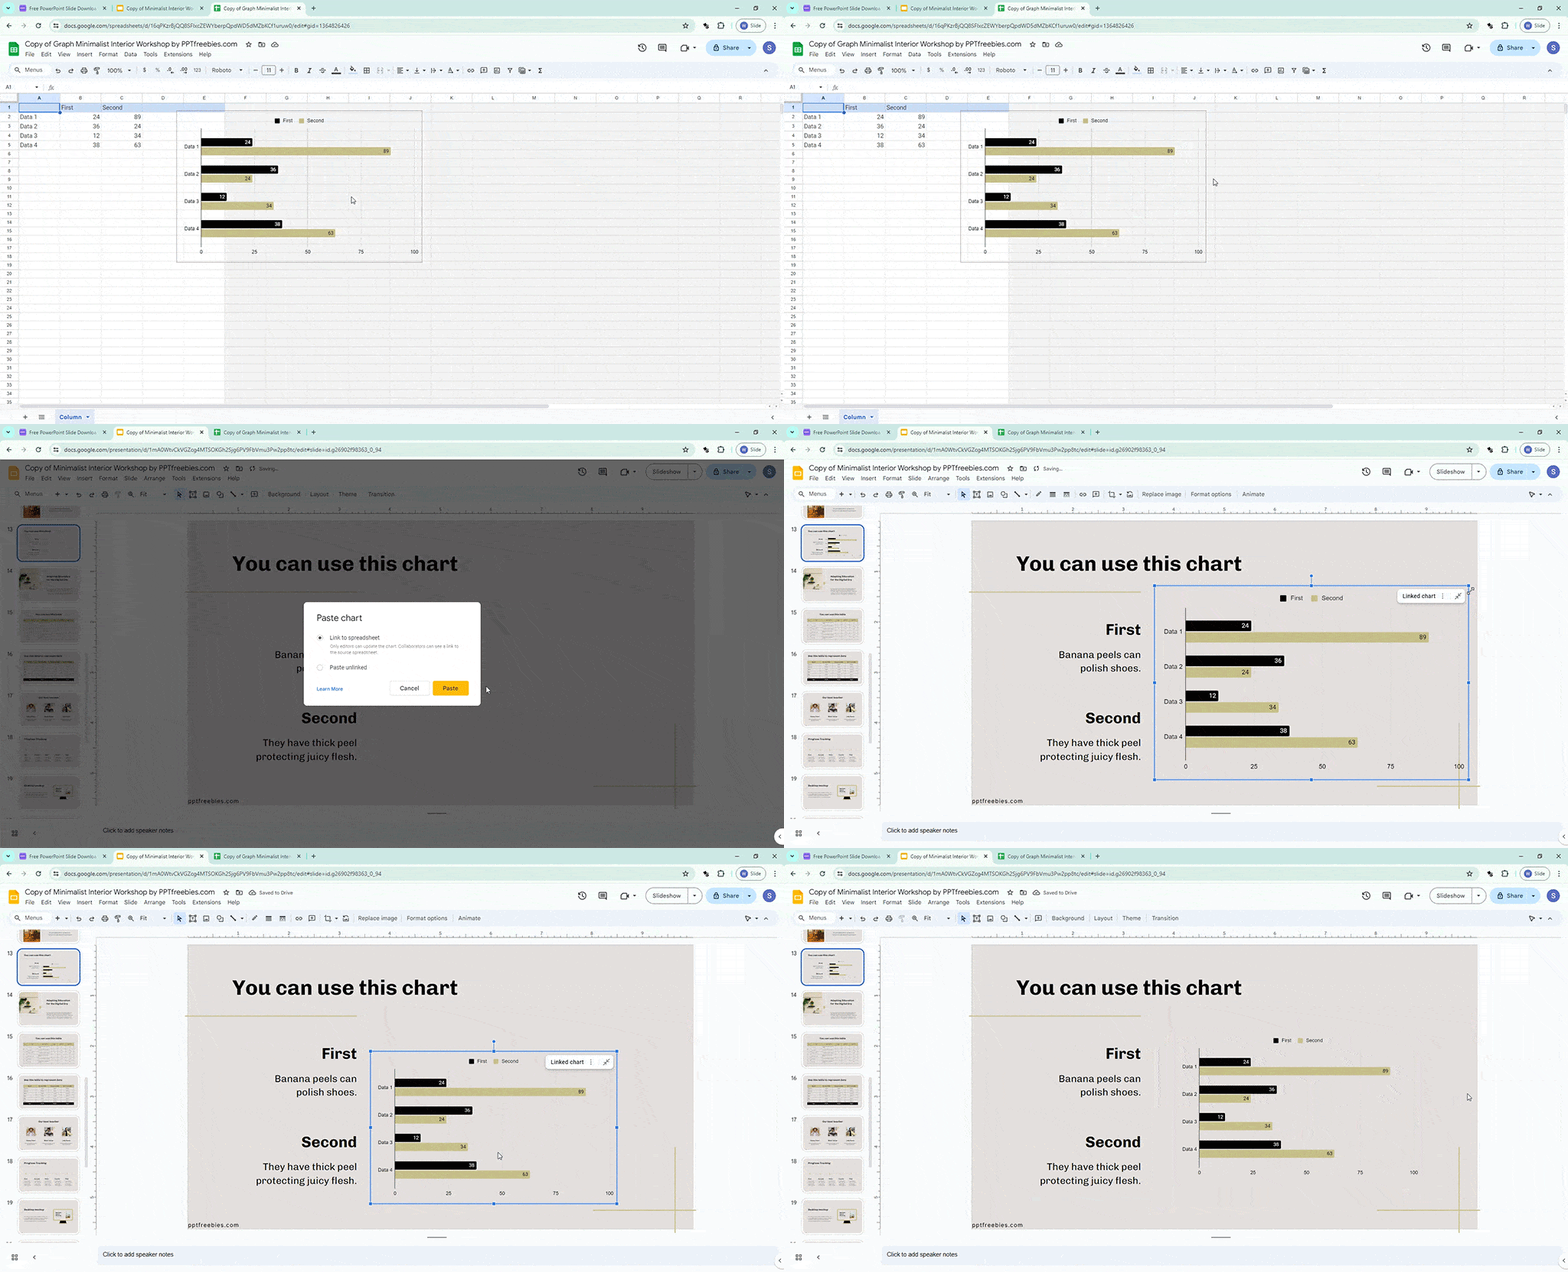
After you have finished filling in the data and modifying the chart, now you can paste the new chart into the Google Slides file. First click on the chart, then press Ctrl + C (or Cmd + C). Next, you return to the Google Slides file and delete the old chart, then paste the new chart by pressing Ctrl + V (or Cmd + V). Here, 2 options will appear, namely “Link to spreadsheet”. If you choose this one, then when you edit the data in the spreadsheet file, you can immediately update the chart by pressing the “Update” button on the chart in Google Slides without repeating this pasting process. Likewise, if you choose the second option, “Paste unlinked”, then any changes to the spreadsheet file will not affect the chart.

Following and understanding How To Edit Chart In Our Templates will help you easily customize the charts. You can also practice in some of our presentations. Various templates are available according to your needs and can be downloaded for free, without registration, and without limits.
